[ #Trading Tips : #Inverted #Charts ] #TOS
Learning is a never ending task. A popular saying states “You snooze, you lose”. Meaning, you must be prepared and ready. You must be at alert and ensure you levels are set properly.
Trading stocks is never an easy thing to do. You as a retail investor is going against so many things, Engineers — Doctors — Coders who have built and backtested algorithms. Institutions who have information available to them at the speed of light.
Straight to business. Inverted Charts makes you see a little bit more accurately where stocks are heading to (not set in stones)…..they at the very least aid you in decision making.
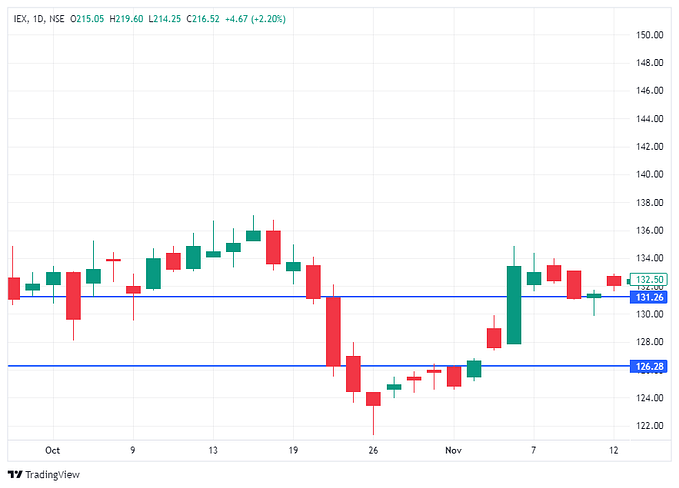
Normal Regular Chart : $HUT [ 10 Years 1 Day] >> Prior to this breakdown it appears $HUT will trade in the channel up (RED and GREEN lines). Alas, it broke that line and turned bearish. You can still make a decision based on this…..but the inverted chart shows you more.

Meanwhile to truly appreciate the normal chart, look at the Inverted Chart below > Look at the values. You can see here on the inverted chart that the price is going up (compared to normal chart) but do you notice it is heading towards ZERO here below. That shows you that trule the stock is in a Bearish mode.

Inverted Charts are more appreciated when you are trading inversely. For example $SPY vs $VIX.
In order to get an inverted chart, just add a minus (-) sign in front of the symbol you need.
There are tools within tools. Keep exploring.
[Edυcαтe yoυrѕelғ вeғore тαĸιɴɢ rιѕĸѕ. ѕтαy cαreғυl! тrαdιɴɢ ѕтocĸѕ cαɴ нαve α loт oғ rιѕĸ, ιғ yoυ doɴ’т cαre ғor yoυr мoɴey ɴoвody wιll.] <<Not a RECOMMENDATION>>

![Options Open Interest [OI] Change in ThinkOrSwim [TOS] Free Script](https://miro.medium.com/v2/resize:fit:679/1*hjmug6TBNxI92RqmiTSGVg.jpeg)